Timeline.js: New Features and Extending with Panzoom and Tippy.js
The Timeline.js module was written to draw connections between entities in a timeline to represent how they develop, split, merge and so on. It's intentionally quite minimal in what it does (and consequently quite small – < 20Kb, minified but uncompressed), but can be extended to make a more full-featured diagram. This post details the additions to Timeline.js and an example of extending it using Panzoom and Tippy.js from a recent project, a Timeline of Electoral Parties in the Republic of Ireland.

Timeline.js was originally written for the Irish Left Archive project, to replace a previous implementation that depended on an unnecessarily large JS library despite using only a small part of its feature set, and was consequently painfully slow to load and render. So the goal was to keep it as simple as possible and let any extra features be added with external libraries as needed.
However, starting a new project using Timeline.js spurred me to make some improvements and add some new features to the module.
New features and improvements
Define content in JS or HTML
Timeline.js originally took the entry information from the data- attributes of entries in the page HTML. However, this isn't always the most convenient way to put the information together, so they can now also be set as an array of JavaScript objects.
This allowed me to pull the data from CSV files rather than maintaining it directly in the HTML with swathes of attributes. In this case, I used CSV-Rex to parse the CSV, and then passed the data to the diagram as below (the function wrapping the parsing of the CSV is just to drop any blank cells from the object properties):
Events
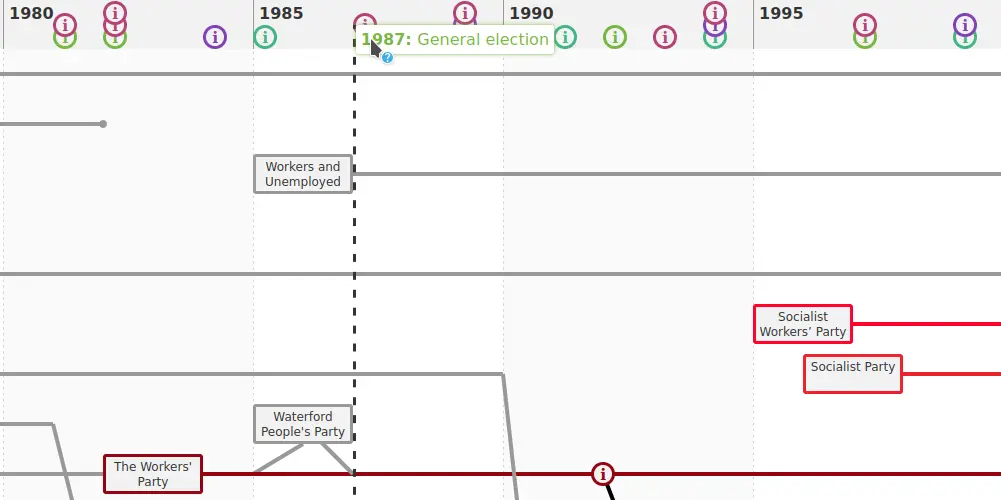
I also added the ability to add events to the diagram – small expandable information markers for a specific date or particular entry. As with the entries, these can be added in the HTML or via JavaScript.
For general events, an information marker appears on the date line at the top of the diagram. Hovering over or touching the marker reveals the short message and displays a line across the timeline entries on that date for additional context. This was useful in the electoral parties example to indicate when elections occurred and the context of parties active at that time.
Automatic positioning and groups
The automatic positioning of entries on the vertical axis was never very sophisticated, so that has been improved in the current version. The logic remains simple, but now produces better results without the need to resort to manually positioning entries. In particular, I've added a grouping feature, so that entries can be kept broadly in the same section of the diagram even when they don't share any direct connections.
This solved an issue on the electoral parties diagram where it made more sense to group parties on the left and right of the political spectrum together, even if they aren't directly connected, rather than mixing them as space allowed. A group name can be added to any or all entries, and matching names will be positioned near each other.
The group feature is useful for large diagrams as an intermediate level between manual and automatic positioning.
Extended features and Panzoom
The timeline of electoral parties includes a description and legend on the diagram, a search filter with auto-complete for finding organisations by name, and panning and zooming functionality.
The legend is a simple div with the included timeline-exclude class, which prevents the module from trying to process it as an entry. It shows a short description and link, and a toggle button to expand the legend entries. The toggle is shown and hidden with a simple Javascript class, which is included in the site as part of the ILA UI Elements module, though this could be done in lots of ways, of course; using Jquery show() and hide() for example.
The controls contain an auto-completed search filter and buttons for zooming. These are included in Timeline.js, but depend on @panzoom/panzoom being included and enabled. Panzoom isn't bundled with Timeline.js, but can be passed in the configuration to enable standard panning and zooming with touch and/or mouse actions, as well as additional functions for panning to a particular entry – including using a URL hash on load, which allows linking directly to an entry in the diagram. (For example, this link will open directly at the 'Labour' entry).
The controls are easily enabled with the id and classes provided in the documentation.
Wikipedia popovers with Tippy
The timeline also includes a popover feature with a brief description of each party taken directly from Wikipedia and link for more information. This is implemented using Tippy.js and an additional dataset property containing the page URL for any entry which has a Wikipedia page.
Here's the simple class used for the electoral parties diagram. It assigns Tippy to each selected entry and sends a request to Wikipedia's API when the popover is activated. The content then consists of the title, the first few sentences of the Wikipedia page, and a link to the page for more information.
/**
* Add a Tippy popover with a Wikipedia summary for entries with a `data-wikipedia` attribute.
* @param {string} selector
*/
This is then instantiated on the timeline page after Timeline.js itself:
new;
I've also extended the search functionality to trigger the popover as well as pan to the entry. Timeline.js emits a timelineFind event when the panToEntry() method is called, so a click is attached to that to trigger the popover.
'timelineFind',
All put together, I think the result extends the diagram quite well and provides some useful additional context. You can explore the Timeline of Electoral Parties in the Republic of Ireland here:
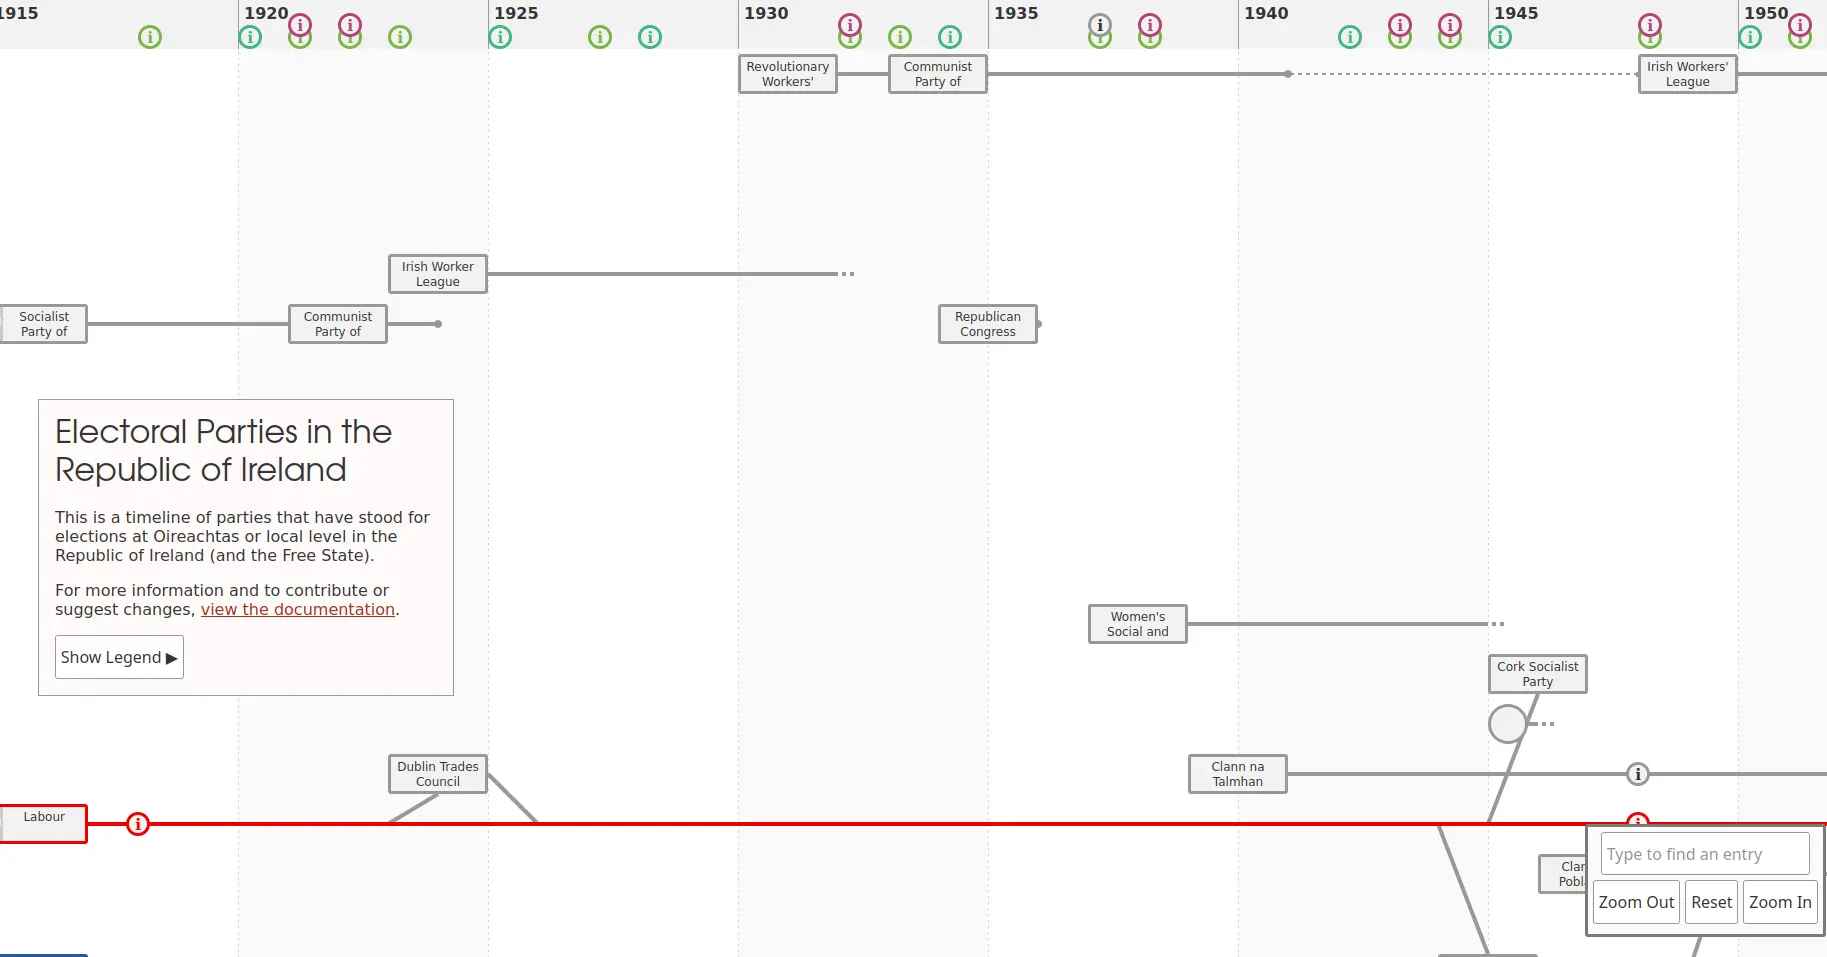
Electoral Parties in the Republic of Ireland
A diagram showing the development of Electoral Parties in the Republic of Ireland.
Visit siteThe code and data are available in this Git repository: